Indoor environmental quality (IEQ) is crucial for human health, comfort, and productivity, especially since people spend the vast majority of their time indoors. This project introduces a comprehensive IEQ monitoring system that utilizes a network of fixed sensors and a mobile robot to collect environmental data. The system is designed to assess conditions like temperature, humidity, CO2, and VOC levels, identify anomalies such as localized hotspots, and visualize the data in an intuitive dashboard, providing a powerful tool for maintaining healthy indoor spaces.
Introduction
Maintaining an ideal indoor environment is key to our well-being. Traditional monitoring systems often rely on a few stationary sensors, which may not capture the full picture of a space. To address this limitation, our project integrates a Turtlebot4 mobile robot with a mobile sensor node, four fixed sensor nodes, and a centralized server. The robot navigates the area to gather high-resolution spatial data, complementing the continuous temporal data from the fixed nodes. This combined approach allows for a detailed and accurate assessment of the indoor environment, enabling the detection of anomalies that might otherwise go unnoticed.
Technical Approach
The system is built on a distributed architecture where all components communicate over a shared Wi-Fi network. The core components include the sensing nodes, a central server, a database, and a user-facing dashboard.
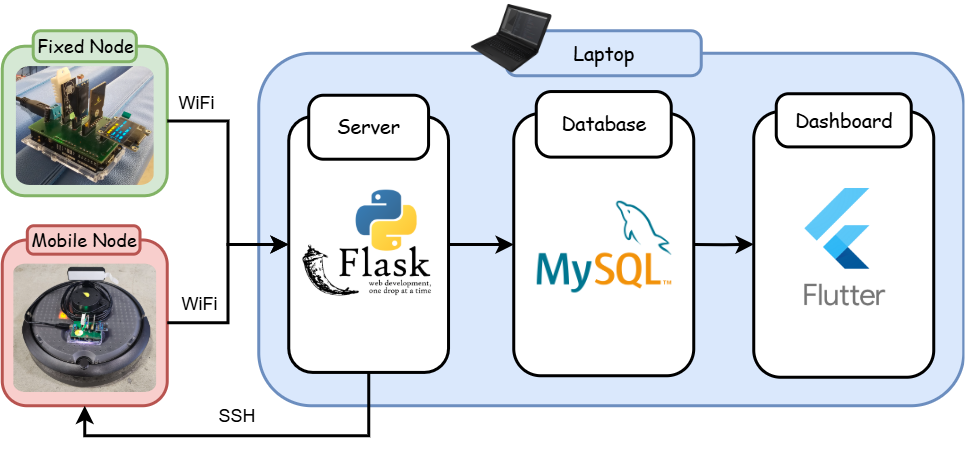
Figure 1. Overview of the system architecture.
> 1. Sensing Nodes
Both fixed and mobile nodes are built on the Arduino platform, equipped with sensors for temperature, humidity, ambient light, eCO2, and TVOC. Each node features a local OLED display for real-time readings and status updates, including Wi-Fi connectivity and sensor errors. The four fixed nodes are placed at the corners of the room, while the mobile node is mounted on a Turtlebot4 Lite.
> 2. Data Collection and Storage
The sensing nodes transmit data via HTTP POST requests to a Flask web server running on a laptop. The server processes incoming data and stores it in a MySQL database. We use two separate tables: one for the continuous readings from the fixed sensors and another for the location-tagged readings from the mobile robot.
> 3. Robot Navigation
The TurtleBot 4 Lite, running ROS 2, autonomously navigates the room following a pre-defined, comb-shaped path. This ensures thorough coverage of the space. As the robot moves, the attached mobile sensor collects environmental data, which is correlated with the robot's position data from ROS to create a detailed spatial map of environmental conditions.
> 4. Dashboard and Visualization
A cross-platform dashboard built with Flutter serves as the user interface. It connects to the Flask server's API to fetch and display data in real-time. The dashboard features cards for key metrics, historical trend charts, and a list of recent readings. Its most powerful feature is the temperature heatmap, which visualizes the spatial distribution of temperature across the room.
Results
We tested the system in a 5m x 5m lab space at the University of Illinois Urbana-Champaign. To simulate an anomaly, a small heater was placed in one corner of the room.
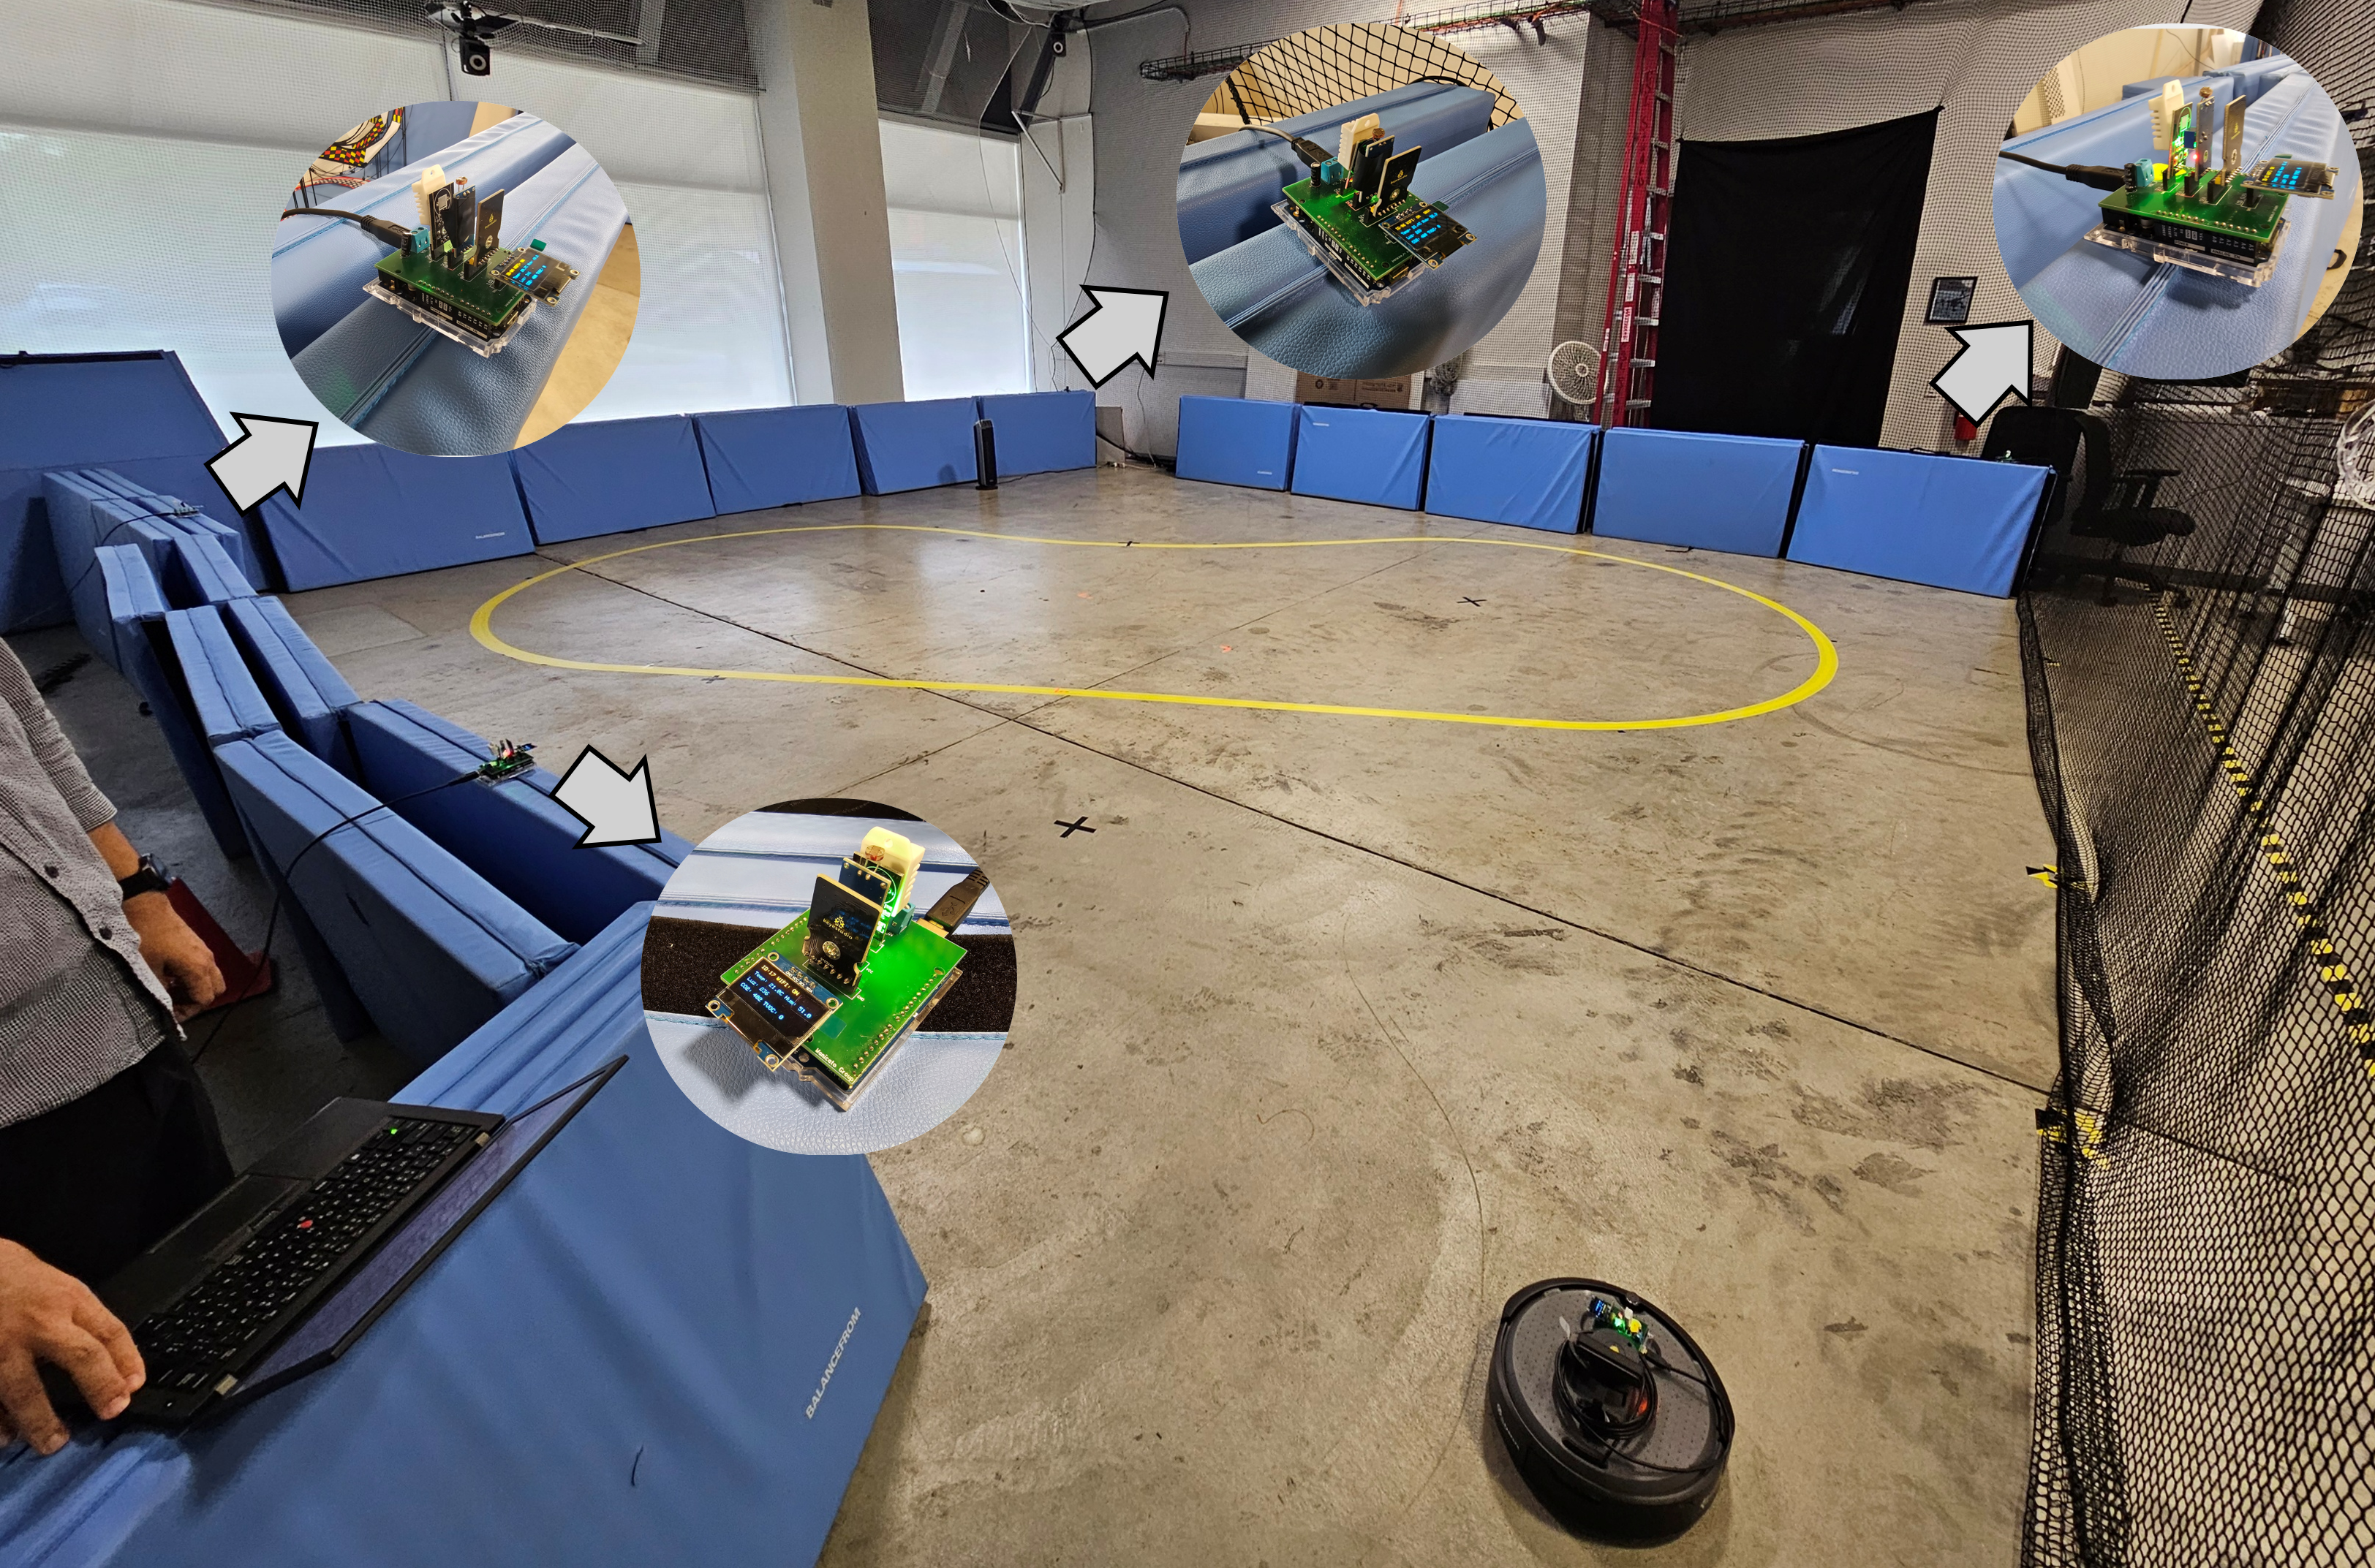
Figure 2. Testing environment setup.
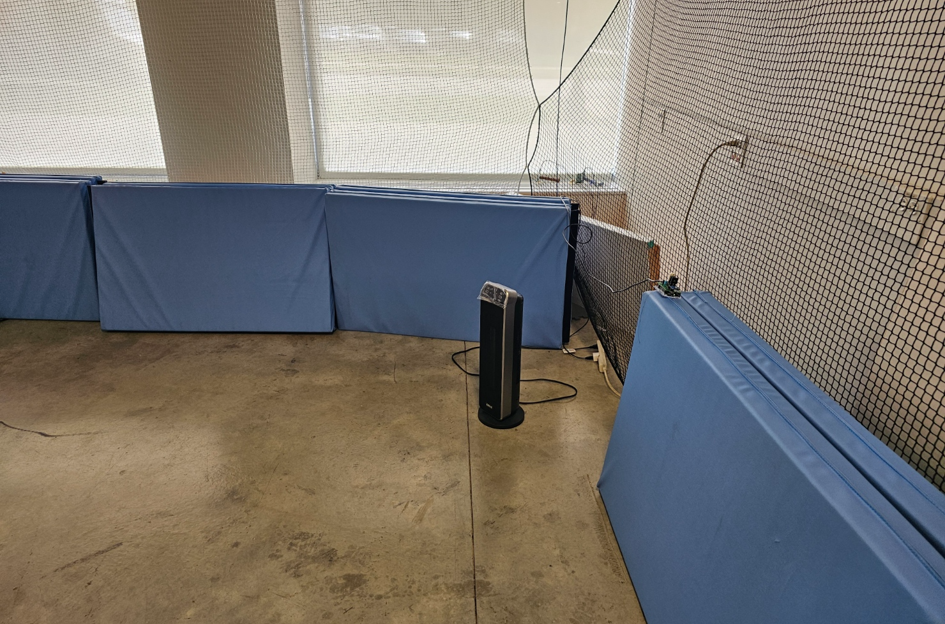
Figure 3. Heater setup in the environment.
> Heatmap Visualization and Dashboard
The core result of our project is the ability to visualize temperature distribution using heatmaps generated from both fixed and mobile sensor data. We used Inverse Distance Weighting (IDW) for spatial interpolation.
The heatmap from the four fixed sensors provided a real-time snapshot but with lower spatial resolution. In contrast, the heatmap from the mobile sensor's scan offered a much higher-resolution map, pinpointing the location of the heat anomaly more accurately. Both methods successfully identified the hotspot created by the heater, demonstrating the system's effectiveness in detecting environmental anomalies.
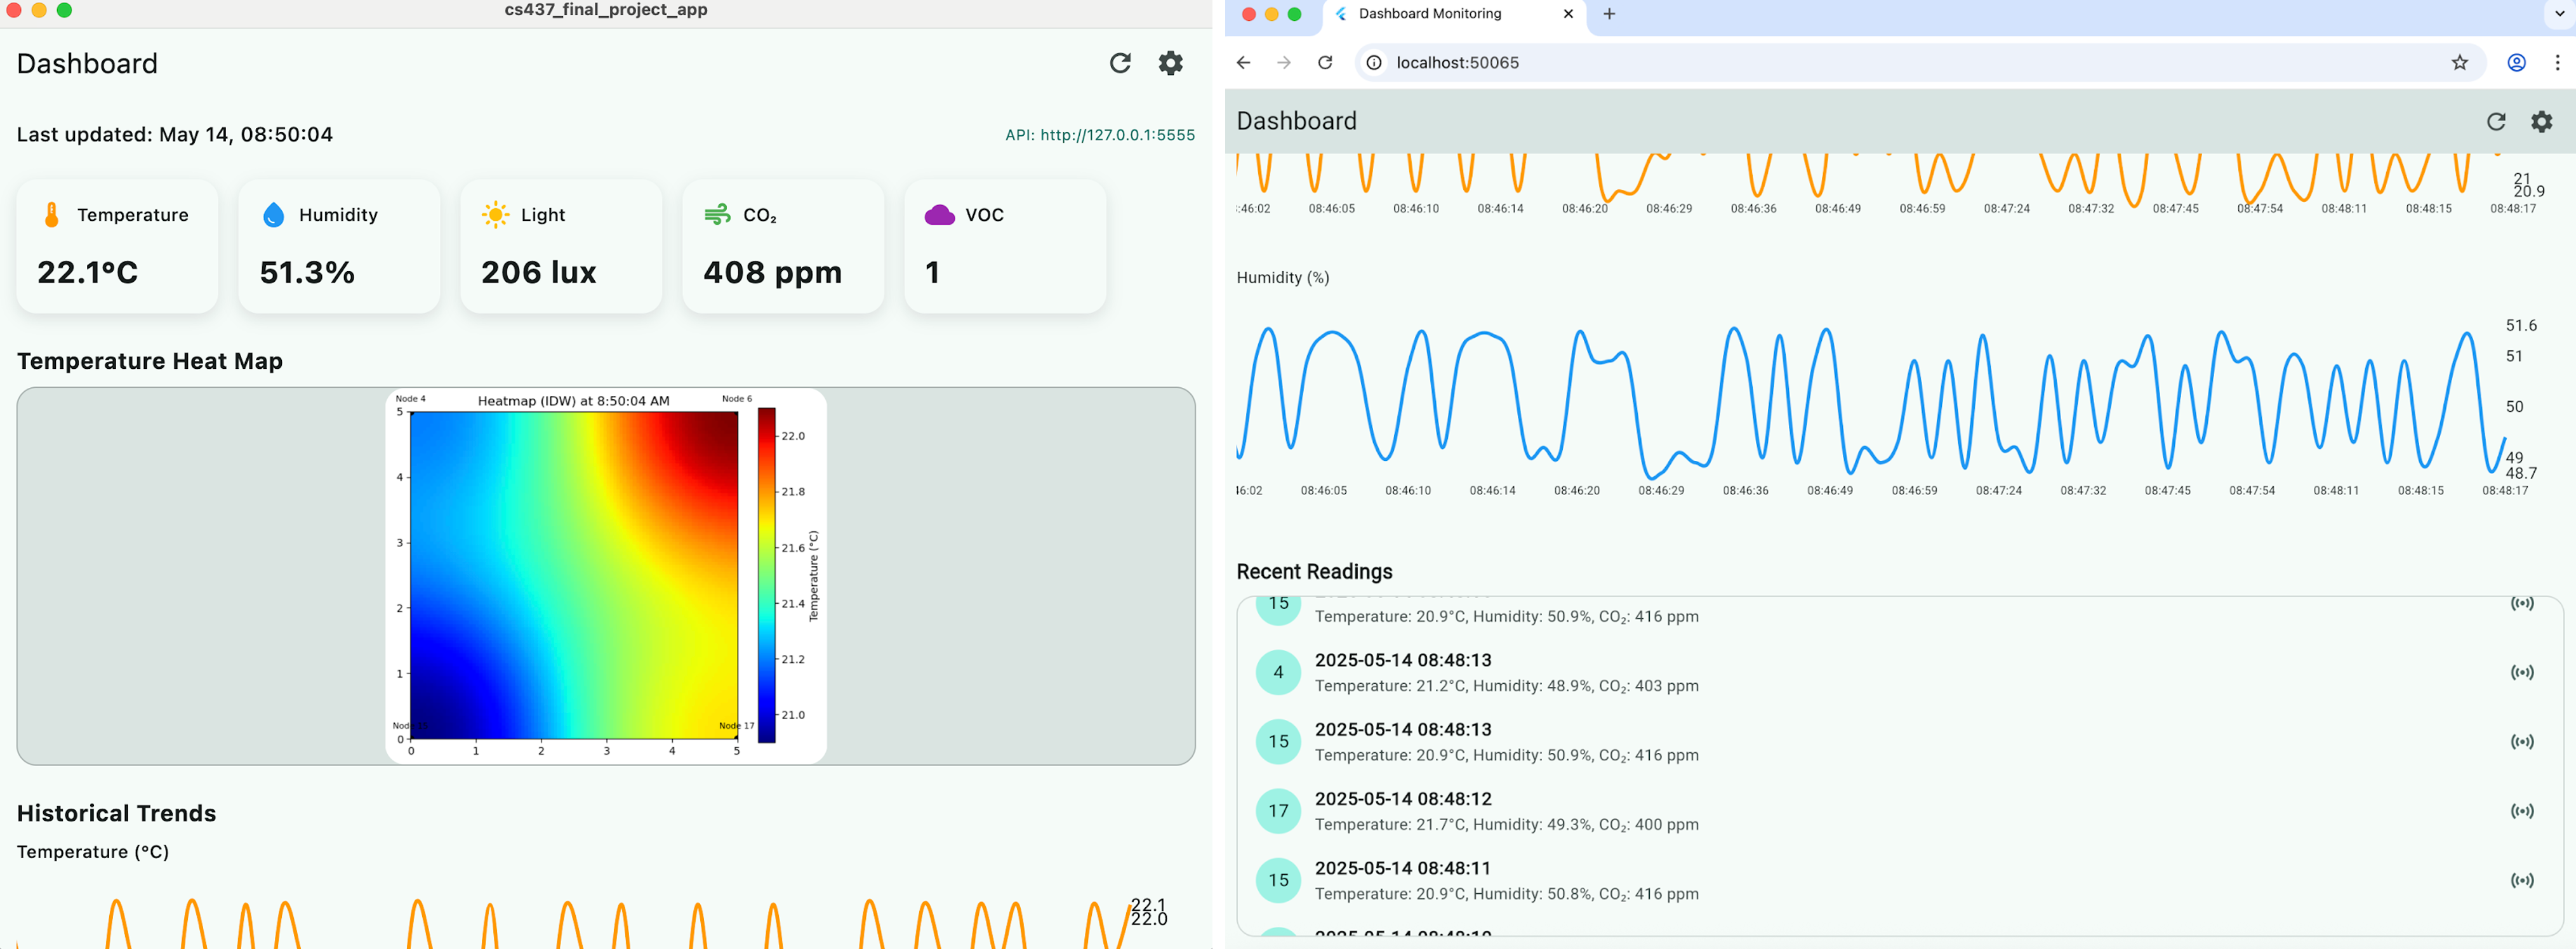
Figure 4. Overall heatmap visualization and dashboard.
> Demo Video
Watch a full demonstration of the system in action, from robot navigation to live data visualization on the dashboard.